7.2 Linear relation
Imagine you are a biologist that conducts their research in the Amazon rainforest known for biodiversity and heavy rainfalls (see the name). You divided the area into 20 equal size fields on which you measured the volume of rain (per a unit of time) and biomass of two plants (named creatively plantA and plantB). The results are contained in biomass.csv file, let’s take a sneak peak at them.
import CSV as Csv
import DataFrames as Dfs

# if you are in 'code_snippets' folder, then use: "./ch07/biomass.csv"
# if you are in 'ch07' folder, then use: "./biomass.csv"
biomass = Csv.read("./code_snippets/ch07/biomass.csv", Dfs.DataFrame)
first(biomass, 5)
| plantAkg | rainL | plantBkg |
|---|---|---|
| 20.26 | 15.09 | 21.76 |
| 9.18 | 5.32 | 6.08 |
| 11.36 | 12.5 | 10.96 |
| 11.26 | 10.7 | 4.96 |
| 9.05 | 5.7 | 9.55 |
I think some plot would be helpful to get a better picture of the data (pun intended).
import CairoMakie as Cmk

fig = Cmk.Figure()
ax1 = Cmk.Axis(fig[1, 1],
               title="Effect of rainfall on biomass of plant A",
               xlabel="water [L]", ylabel="biomass [kg]")
Cmk.scatter!(ax1, biomass.rainL, biomass.plantAkg,
             markersize=25, color="skyblue",
             strokewidth=1, strokecolor="gray")
ax2 = Cmk.Axis(fig[1, 2],
               title="Effect of rainfall on biomass of plant B",
               xlabel="water [L]", ylabel="biomass [kg]")
Cmk.scatter!(ax2, biomass.rainL, biomass.plantBkg,
             markersize=25, color="linen",
             strokewidth=1, strokecolor="black")
Cmk.linkxaxes!(ax1, ax2)
Cmk.linkyaxes!(ax1, ax2)
fig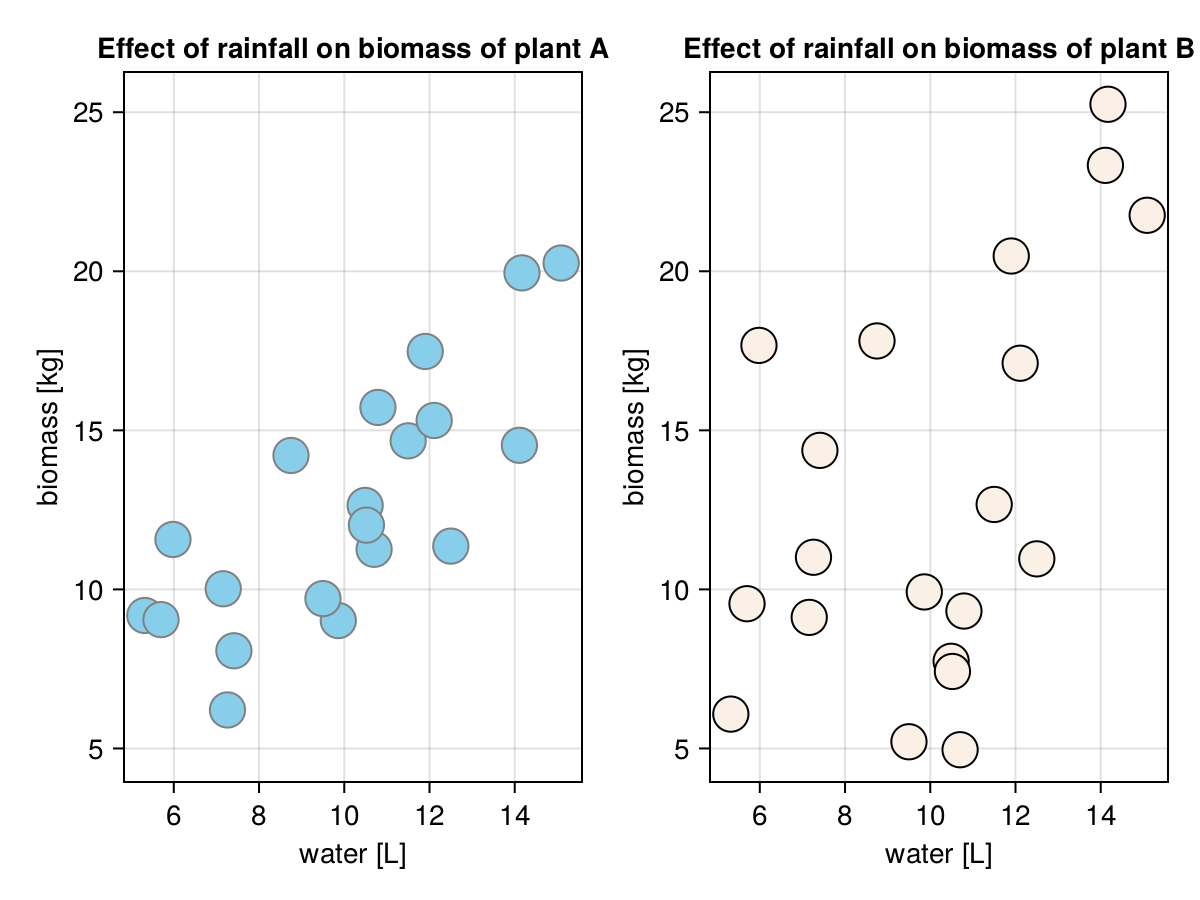
Overall, it looks like the biomass of both plants is directly related (one increases and the other increases) with the volume of rain. That seems reasonable. Moreover, we can see that the points are spread along an imaginary line (go ahead imagine it) that goes through all the points on a graph. We can also see that plantB has a somewhat greater spread of points (which may indicate smaller dependency on water). It would be nice to be able to express such a relation between two variables (here biomass and volume of rain) with a single number. It turns out that we can. That’s the job for covariance.